{{ acc.lead }}
{{ s.body }}
A field guide to immersive practice.
Immersive practice is a chorus of distinct disciplines, skills, and ways of working. This prototype is a first step toward mapping that field for those of us arriving from elsewhere.
Choose a lens or view above and begin exploring.
Three ways to read the field.
Two controls shape what you see. A lens sets the point of view: read the field by disciplines, by roles, or by methods. A view sets the shape it takes. Pick a lens and a view from the bar above, then explore.
A plain A–Z list of everything in the current lens. Good for getting the lay of the land: scroll the whole list, then click any entry to read what it is and how it connects to the rest.
The guide sorted into a tree, one column at a time. Start broad and drill down, with each pick narrowing things, to see how the different areas group together and split apart.
Everything shown at once as a connected map. Related entries sit close together and the busiest ones stand out; switch the lens to see the picture rearrange around whatever you care about.
Seven ways to slice the field.
{{ l.blurb }}
This early prototype is based on years of project notes and practice. Its coverage is incomplete and reflects one practitioner's perspective.
A later version will introduce structured sourcing and contribution methods, allowing it to grow into a broader and more reliable field resource.
This is an early public alpha of both the visualisation software and the dataset, so expect rough edges and things that change. It's built to be responsive and work on mobile, but the Constellation view in particular hasn't been fully tested across a wide range of mobile devices.
{{ accSel.lead }}
{{ s.body }}
An independent studio for immersive media, research, and publishing.
MWG Design & Research is the independent practice of designer and researcher Michael Golembewski, working across immersive media, interaction design, and research.
The studio designs and develops immersive experiences, undertakes applied research, and builds tools and workflows for experimental projects. Its work takes shape across cultural, public, and commissioned settings, often in collaboration with creative, technical, institutional, and community partners.
MWG Design & Research develops its own projects and publishes writing on the ideas, methods, and structures shaping immersive practice, with a particular interest in work that contributes meaningfully to public and cultural life.
{{ a.body }}
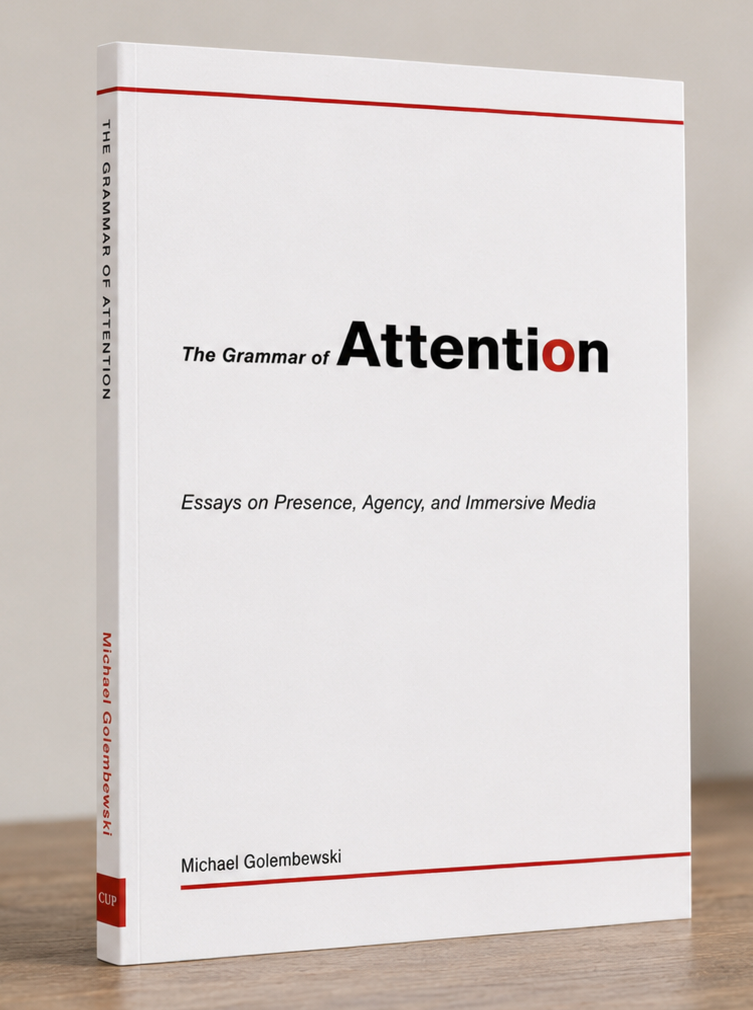
The Grammar of Attention
Essays on Presence, Agency, and Immersive Media
A collection of 25 essays about how immersive experiences take shape, and how they make meaning through presence, agency, and attention — a close view of the medium from within, tracing the early language of a form still learning to speak.
Overview
The book is composed of 25 essays, each considering a distinct aspect of how immersive work is made, encountered, and understood. Together they trace the early language of the medium through practice, craft, and the decisions that shape experience from first sketch to final showing.
The chapter below, Beg, Borrow, Steal, looks at the formative stage of a developing medium — how immersive work grows through borrowing, experimentation, and synthesis, and how the constraints of real production help shape the grammar through which XR begins to speak.
Beg, Borrow, Steal
Every new medium begins by borrowing. At first it leans on the languages of older forms, then — through experiment, accident, and persistence — it synthesises those borrowings into a grammar of its own. Immersive media stands today where cinema once stood: poised between imitation and invention, testing the edges of what it can be. History gives us precedent. Cinema occupied this same uncertain ground.
Cinema: borrowing and synthesis
The cinematic language we now take for granted — shot/reverse shot, montage, close-up, tracking — did not arrive fully formed. It emerged gradually from the convergence of two older traditions: theatre and photography.
From theatre, cinema inherited mise-en-scène, blocking, and the proscenium’s habit of treating the world as a framed stage. Early performances were exaggerated, scenes unfolded in unbroken time, and the camera was simply a silent spectator.
From photography, it borrowed the rectangular frame and the capacity to isolate fragments of reality. The lens offered composition, realism, and documentary authority — gifts that theatre alone could not supply.
At first, film was essentially theatre captured by a photographic device. Early directors leaned toward theatrical spectacle (Méliès) or photographic actuality (Lumière). But when the two streams met through editing, something new appeared. The collision of staged performance and photographic image created the conditions for a new expressive system. Editing transformed theatre’s continuous time and photography’s frozen instant into a fluid medium capable of leap, condensation, and expansion.
By the time Eisenstein assembled Battleship Potemkin (1925), cinema had discovered that meaning could be constructed not by reproducing theatre or photography, but by combining them — synthesising their affordances into a language neither parent medium possessed.
Immersive media: borrowing and beyond
Immersive media is undergoing a similar phase. But where cinema drew from two parent traditions, XR borrows from at least four.
At present, immersive works are still in the borrowing phase. Some resemble cinematic spectacle with head-tracking, others feel like games with their interactivity pared down, and others lean heavily on theatre with technology as augmentation. HCI undergirds them all, often invisibly.
The next phase, as with cinema, will be synthesis. Only when cinema, games, performance, and HCI collide — fully and without apology — will immersive media develop a native grammar: expressive units that make sense only inside an immersive frame. Presence, agency, and embodiment will become the equivalents of montage — not borrowed techniques, but the medium’s own building blocks.
Speculative candidates
We cannot yet know what will become canonical, but a few candidates glimmer at the edges of practice:
{{ c.v }}
None of these is fixed. All are provisional. But so, too, were cross-cutting and montage in the 1910s — half-experiments, half-accidents that became the language of cinema once they were repeated, named, and refined.
An emerging grammar
Immersive media stands at a similar threshold. The question is not whether a grammar will emerge — it will — but what will determine it. And the answer is the same as it was for cinema: practice. Each new work nudges the medium toward coherence. The language will not be devised by a single auteur but by the accumulated effort of a community — artists, designers, engineers, performers, researchers, curators, and audiences — teaching the medium how to speak.
To live through this moment is a privilege. We are not merely watching a medium find its language. We are participating in its first attempts to form sentences.
Michael Golembewski is a designer and immersive media practitioner working across XR installation, interaction design, and experimental media. His work explores how presence, attention, and craft shape experience and meaning in emerging forms. This is his first book.
Get in touch
Registered in the United States (Massachusetts)
All material © 2026 MWG Design & Research, LLC. All rights reserved.
This page doesn't exist.
The link may be old, mistyped, or the page has moved.
{{ notfoundLabel }} →